
SankeyMATIC: show the flow, check the totals
Where did 100 applications go? SankeyMATIC can turn a short list of flows into a diagram whose bands compare amounts through stages. We tested a fictional application process, downloaded its actual PNG and SVG, and deliberately removed eight outcomes. The tool showed the mismatch instead of making the missing count disappear.
Quick facts
- Best fit: explain how a quantity splits through stages, such as a budget, application process or other measured flow.
- Input format:
Source [Amount] Target, one flow per line. No chart code was needed in our test. - Actual check: six flows, seven nodes, 100 starting applications and 100 terminal outcomes.
- Exports tested: actual 1200 x 1200 PNG, an SVG file and a readable saved-work text file.
- Failure check: reducing No offer from 38 to 30 produced Total Inputs 100 versus Total Outputs 92; the imbalance table showed Interviewed 50 in, 42 out, difference 8.
- Cost: official FAQ says free to use. No signup, email, card or payment was requested in our builder/export route.
- Privacy: provider says diagram processing and exports happen in the browser. Its policy separately describes IP/request logs and third-party ads. Public links can expose your diagram data.
Why use a flow tool beside a chatbot?
A chatbot can help tidy labels or suggest a data layout. SankeyMATIC gives you a visible, adjustable diagram from explicit flow values, plus image exports and a count check you can inspect. Keep the original table as your source of truth. Attractive bands do not prove that the underlying data is right.
Use a Sankey when showing how the same measured quantity moves or divides across stages. Do not add overlapping categories as though they were separate outcomes, mix currency with counts, or combine percentages with raw totals. These are data-design checks, not mistakes a chart tool can reliably infer for you.
Our fictional 100-application example
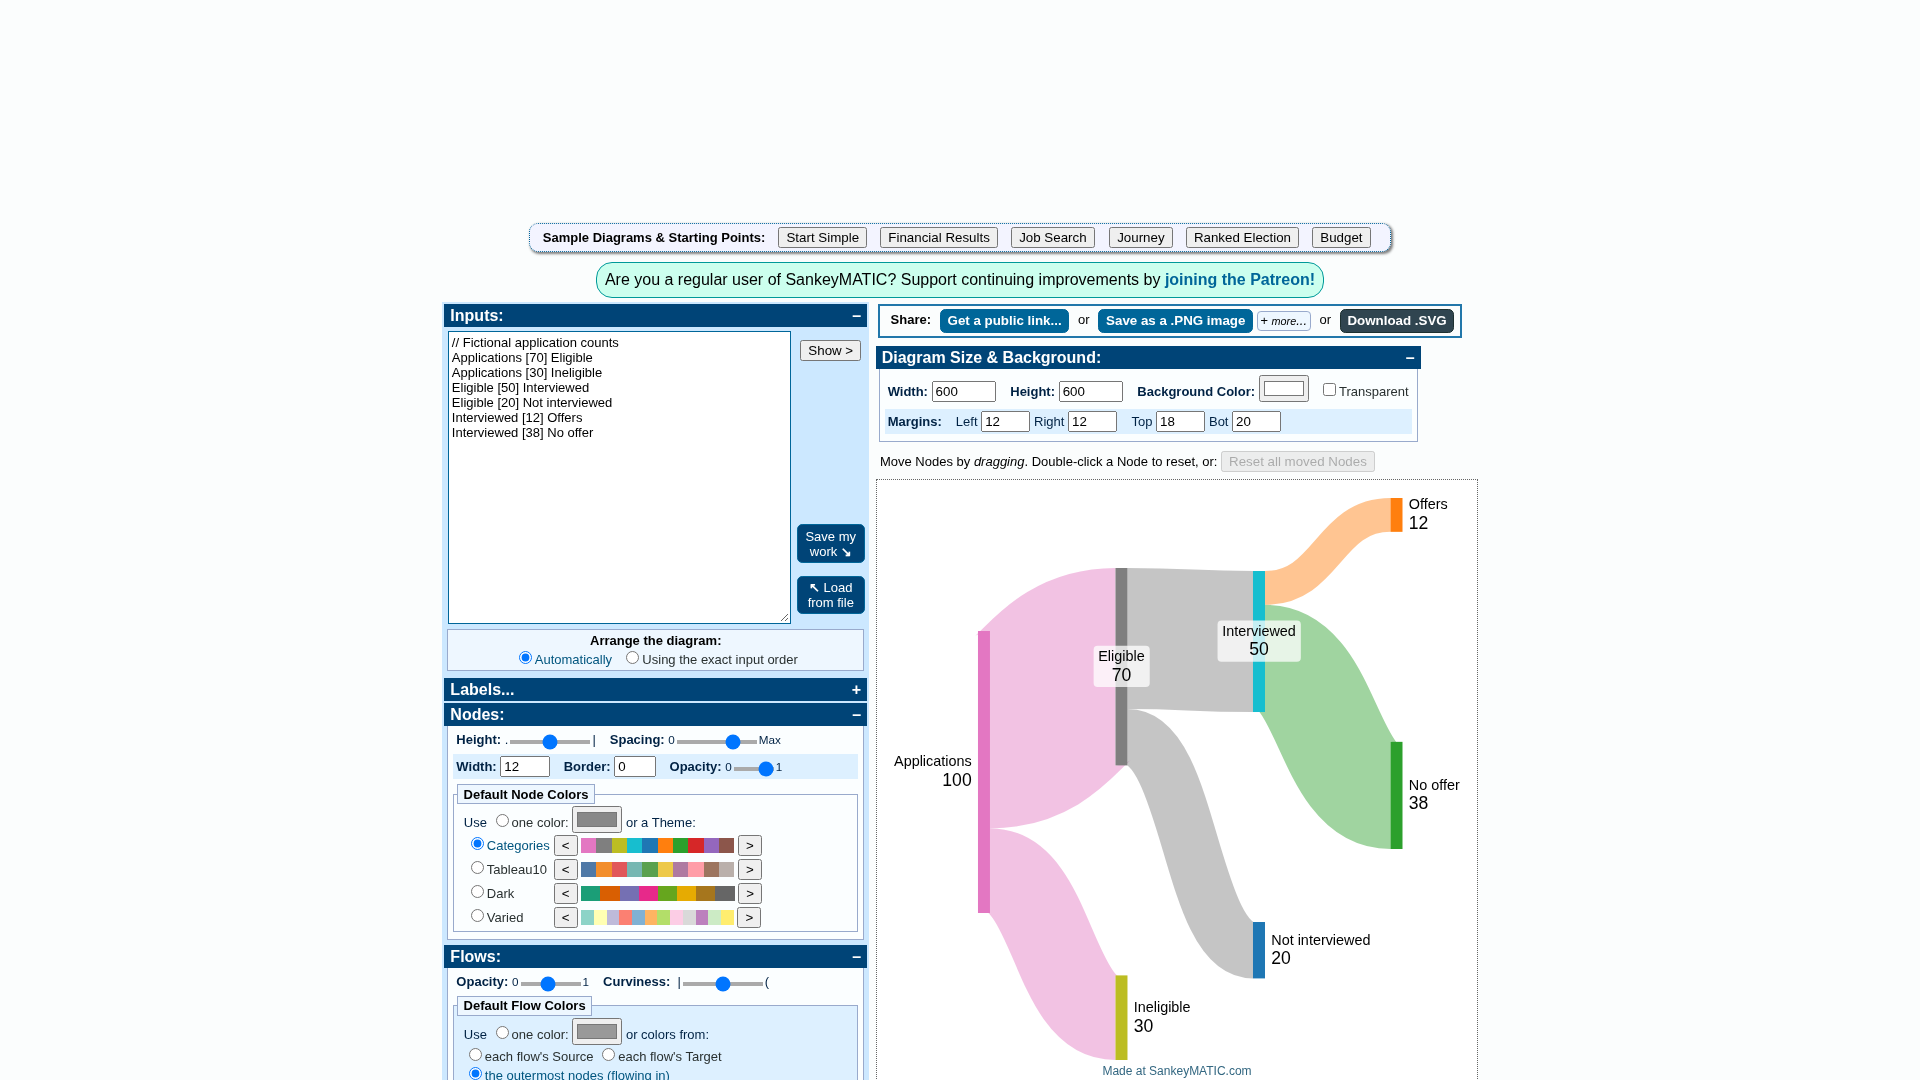
On 29 October 2026 we opened the official builder, replaced Diagram Inputs with the lines below and chose Show >. These are fictional application counts, not real people or a claim about recruitment performance.
// Fictional application counts
Applications [70] Eligible
Applications [30] Ineligible
Eligible [50] Interviewed
Eligible [20] Not interviewed
Interviewed [12] Offers
Interviewed [38] No offer
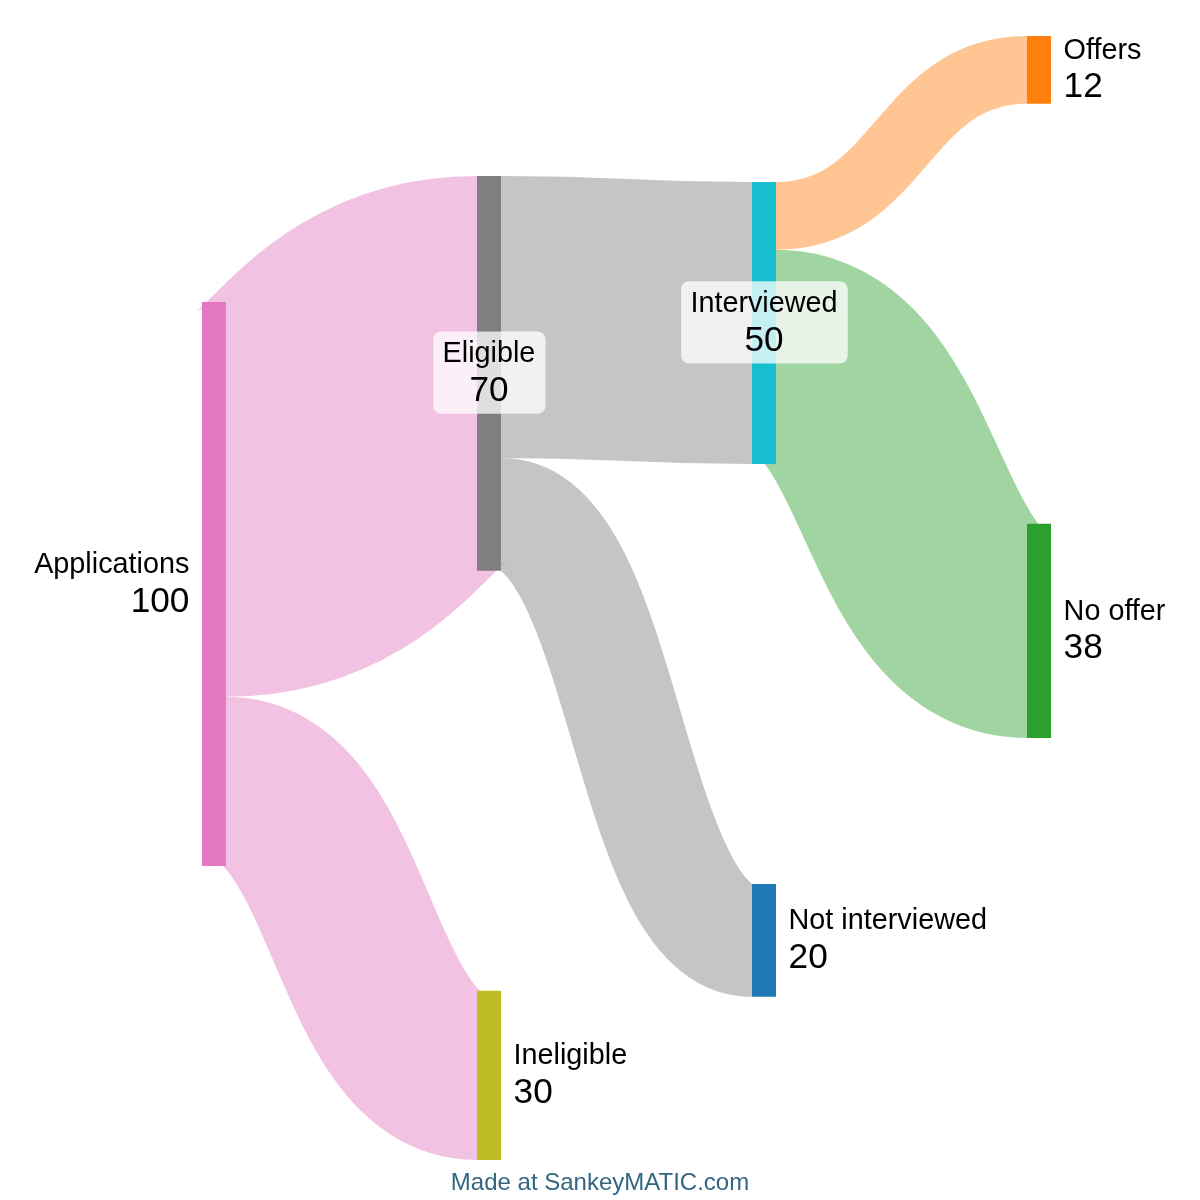
The diagram showed 100 Applications splitting into 70 Eligible and 30 Ineligible. Eligible split into 50 Interviewed and 20 Not interviewed. Interviewed split into 12 Offers and 38 No offer. Each count was checked against the input.
The terminal outcomes sum to 100: 30 + 20 + 12 + 38. Do not add every node value together: intermediate nodes count the same flow again. For example, 70 Eligible and 50 Interviewed are stages, not extra applicants.
The actual files we downloaded
We chose Save as a .PNG image and reopened the actual 1200 x 1200 download. All seven labels and checked totals were present. The builder's diagram size was 600 x 600; its default PNG download in this test was twice those dimensions. This is an observed result, not a promise about every setting.
Download .SVG also produced a real vector file. We rendered that file to inspect its labels and flows; we did not test editing it in another application. Save my work produced a readable text file containing the six flow lines and diagram settings. That source file is more useful for future changes than a static PNG alone.
An image is not an interactive dashboard or a live connection to your spreadsheet. If your counts change, update the input and export a new image. We did not test automatic data refresh, mobile editing, huge datasets or every appearance control.
Remove eight outcomes and check again
We changed only Interviewed [38] No offer to Interviewed [30] No offer and chose Show >. A diagram still rendered, but About this diagram reported Total Inputs: 100 > Total Outputs: 92. The imbalance table identified Interviewed: Total In 50, Total Out 42, Difference 8.
That is a useful warning, not an instruction to invent eight outcomes. Return to the source data: perhaps a status is missing, the reporting windows differ or a count was mistyped. In our fictional test the deliberate edit explained the discrepancy. A balanced diagram can still contain incorrect or fabricated values.
A repeatable workflow
- Choose one quantity and unit. For this example it is applications, measured as counts.
- Use clearly named stages and mutually exclusive outcomes. Decide how pending or unknown items will be represented before drawing.
- Enter one
Source [Amount] Targetline per flow. Use the official builder's Show > control to update it. - Compare node and flow values with your source table. Check About this diagram and the imbalance details, not only the coloured bands.
- Read the labels at the size your audience will see. Export a PNG for a static image or SVG for a vector file; reopen and inspect the downloaded file.
- Use Save my work to keep the flow lines and settings for later. Keep the original data and its date separately.
A public link is not a private save
The official FAQ says processing, PNG generation and SVG generation happen within your browser. It explicitly warns that a Public Link exposes the diagram's data to anyone with the link, including the site maintainer. The builder recommends Save my work and Load from file instead when you do not want a public link.
The privacy policy, last updated 11 November 2023, says the site does not read or store diagram inputs, but it collects IP addresses and basic visit information. It describes third-party advertising and possible cookies. Browser-side chart processing does not mean the website makes no network requests. We did not audit its traffic or verify offline operation.
Use fictional or sanitized data for a first try. Do not publish a public link to payroll, private applicant records or other sensitive material. Our test did not create a public link, use an account or connect any Google service. We did not verify India-specific availability; a successful browser test is not a regional-access guarantee.
Free, with support links
The official FAQ says SankeyMATIC is free to use, and the homepage says no email address or trial signup is required. The builder contains Patreon and donation links. We did not make a donation, follow a paid support flow or test a commercial service. We make no unlimited-capacity claim.