
RAWGraphs: turn spreadsheet rows into editable charts
Need a chart for a report, class project or presentation, but don't want to write code? RAWGraphs lets you paste spreadsheet rows, choose a chart and drag columns onto visual roles. Its useful extra is the handoff: the official guide offers SVG output that you can refine in a vector editor, instead of being stuck with a flat screenshot.
Quick facts
- Use: a browser-based, no-code data-visualization tool. It is not an AI chatbot and does not interpret your findings for you.
- Cost/account: the official guide says no fee and no registration required. We used the app without signing in, entering a card or paying.
- Tested: RAWGraphs 2.1.0 browser app on 28 October 2026. Four fictional rows, a bar chart, Category mapped to Bars and Hours mapped to Size.
- Outputs: the official export guide lists SVG, PNG, JPG and RAWGraphs project files. We verified the chart and export controls, but did not confirm a downloaded file or reopen it in another editor.
- Privacy: the provider says inserted data is processed by your browser, with no server-side storage. Its privacy page separately discloses Google Analytics and site logs. Not a zero-tracking claim.
- India: no India-specific availability statement established. Our browser test is not an India-network test.
Why use this beside a chatbot?
A chatbot can suggest a chart or generate one. RAWGraphs gives you visible control over which column drives each chart variable, along with a documented vector-export route for design work. That can help when you want to keep shaping the labels and layout in a graphics editor. For an ordinary bar chart, your spreadsheet's own chart tool may be enough. The stronger reason to explore RAWGraphs is its wider chart library and design handoff, not a claim that it replaces spreadsheets or AI.
Try the four-row route
- Open the official app on a desktop browser. In Paste your data, paste the CSV below, including the header.
- Check that it reports four rows successfully parsed. Verify Category is text and Hours is numeric; wrong separators or decimal formats can change parsing.
- Choose Bar chart. Under Mapping, drag Category to Bars and Hours to Size.
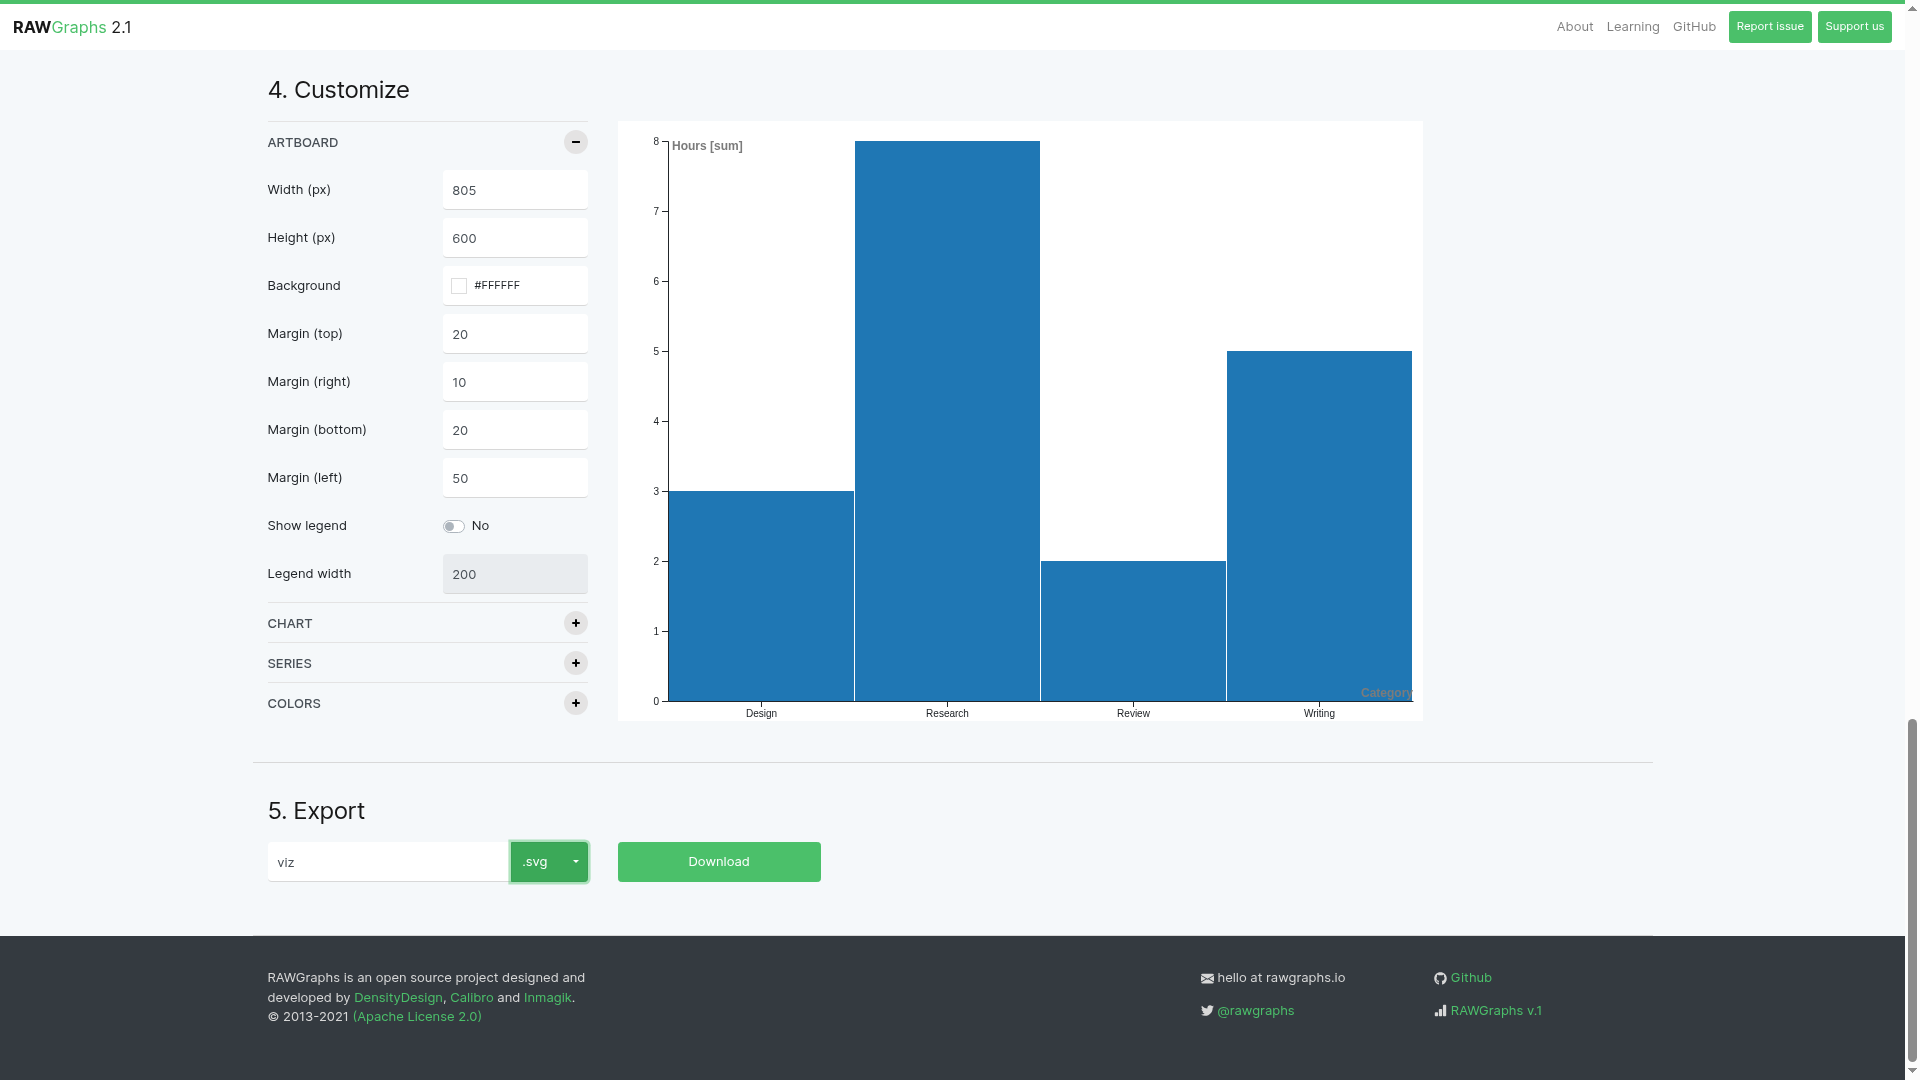
- Inspect the chart before using it. Our default chart sorted the names alphabetically: Design 3, Research 8, Review 2 and Writing 5. The vertical axis was labelled Hours [sum].
- Under Customize, inspect artboard size, margins and chart controls. We left the default styling in place; it still needs a title and source context for a real report.
- Under Export, choose a format and click Download. The official guide recommends SVG for editing individual elements in a vector editor. PNG/JPG are raster images. Save a project if you need to return to the chart setup.
Category,Hours
Research,8
Writing,5
Design,3
Review,2
What we actually checked
The app parsed all four fictional rows and rendered bars matching the values above. We confirmed the displayed zero-to-eight scale, category labels, Hours [sum] axis and SVG/PNG/JPG/project options. We clicked Download with SVG selected, but could not confirm receipt of the downloaded file. Treat exporting and reopening in an editor as documented steps, not a completed part of our test.
Check these before a real report
- The axis says sum. If categories repeat, inspect the aggregation setting and totals instead of assuming one bar equals one input row. We did not test duplicate categories.
- Keep the zero baseline, units, source, period and chart title clear. A rendered chart is not an analysis or a finding.
- Use anonymized or fictional data while learning. Provider statements about browser-side data do not remove your workplace's rules for confidential data.
- The privacy page discloses analytics and hosting logs. We did not inspect network traffic or test offline use.
- This test covers one desktop bar chart. We did not test advanced charts, mobile usability, large datasets, project reloading or editor compatibility.