Check Kerala food-price data by district, item and date
Want a reference for how food prices compare across Kerala districts? The Department of Economics & Statistics publishes a price bulletin with district charts and underlying data tables. We opened the rice district comparison and its dated table. Use it to understand reported market prices, not to demand that every shop sells at the same rate.
Quick facts
- Useful for: households, students and readers comparing reported essential-commodity prices across district centres.
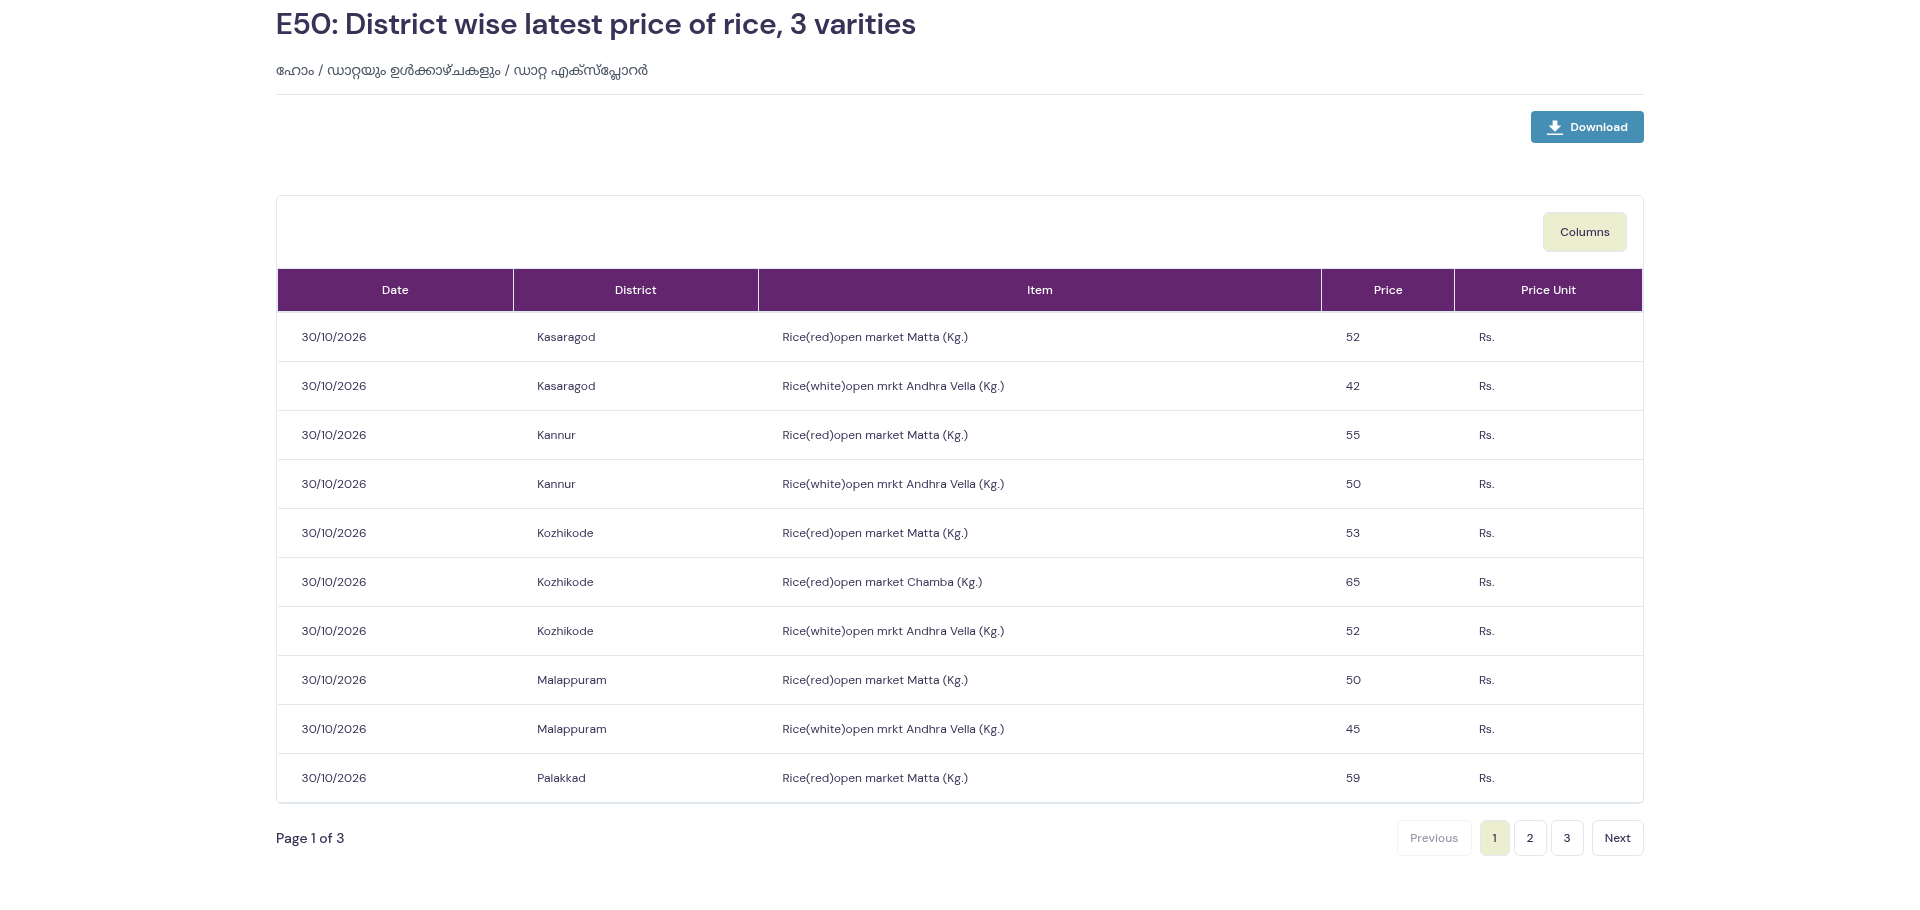
- Tested: Price Bulletin → rice district-price tab → View Data. The resulting table showed observation date, district, exact rice variety, price and unit.
- Freshness: our 31 October check displayed 30 October 2026 observations. Your visit may show a different latest date.
- No login, personal details, Google sign-in, payment or card was requested in this public lookup.
- Not tested: all commodity groups, downloads, historical-date searches, shops, stock, delivery or purchases.
Open the district data, not just the chart
- Open the official Ecostat Price Bulletin. Allow its charts to finish loading.
- Find the rice section. It has tabs for rice, district-wise price and trend. The interface may display Malayalam labels; the district tab appeared as “ജില്ല തിരിച്ചുള്ള വില” in our test.
- Choose the district-wise price tab. We saw a chart headed “E50: District wise latest price of rice, 3 varieties”.
- Use that chart's View Data link to open the underlying table. Our tested destination was the district rice data table.
- Read the Date, District, Item, Price and Price Unit columns together. The item text also specifies the quantity, such as Kg.
- Check the page controls if your district is not on the first page. Our table had three pages; we inspected the first page, including Malappuram.
The date and variety change the comparison
The first page contained separate rows for “Rice(red)open market Matta (Kg.)” and “Rice(white)open mrkt Andhra Vella (Kg.)”. These are different items, even within the same district. Do not collapse them into one generic “rice price”.
Our Malappuram rows were dated 30/10/2026 and had Price Unit “Rs.”, with “(Kg.)” in the item name. We checked the site the following morning. A page-check date is not the date when a market observation was collected. The screenshot preserves this dated example; it is not a continuing price quote.
The department describes the bulletin as average retail prices for the latest available working-day dates. It says observations are collected at district headquarters. They are not a live feed from every shop or every town in that district. Do not mistake the absence of a row for a zero price or an out-of-stock notice.
What this can and cannot tell you
This is useful for a rough budget reference, comparing the same named item across district centres, or citing a dated official observation in a student project. Match the date, variety, quantity and geography before drawing a conclusion.
It is not a legal maximum retail price, a retailer's offer, an invoice check, a quality certification or a promise of stock. A different price in a shop does not, by itself, prove overcharging. Brand, grade, location and the type of transaction may differ. Do not compare wholesale data or farm prices with a household retail purchase as if they were the same series.
Why use the official table?
The concrete value is its structured source record: a department-published observation with district, item and unit labels, plus the date needed to interpret it. An undated search snippet or a chatbot's general estimate can omit those distinctions. The bulletin also explains its collection and comparison method.
The department says charts are updated at 6:30 PM daily, but our test did not audit that schedule or establish that every item updates every day. Read the displayed observation date rather than treating the page as a live price ticker.
Test limits and privacy
We also opened an older daily-price form on the department's portal. Its date field showed 31 October, but no price table populated in our initial interaction. We did not infer that it had today's data or that the service was broken. This guide uses the newer bulletin and its working rice data-table route.
The bulletin initially showed loading links and later rendered its data. Wait for real chart titles or table rows before using the result. The direct table is a latest-data view, not a frozen archive of our example. No account or payment was requested; this does not mean the site collects no technical usage data. We did not submit feedback, contact anyone, test an app or buy anything.
This is an independent AiCoN guide, not a department publication. The screenshot is an actual dated interface crop, not a recreated table. For any report or reuse, cite the underlying department data and its observation date.