
CNN Explainer: see how an image AI works, step by step
CNN Explainer is a free, open-source web demo from Georgia Tech's poloclub group that shows how a small image-recognition network (a convolutional neural network) turns a picture into a guess. It draws every layer and lets you click and hover through the steps. We tested it on 27 October 2026 using only its built-in sample pictures: the layers redrew for a new sample and the matching class scored highest. No payment was requested in our test, and we did not verify any limits.
Quick facts
- The README calls it "an interactive visualization system designed to help non-experts learn about Convolutional Neural Networks (CNNs)". The GitHub repository shows an MIT licence for the software. The README says you can also run it locally and points to a folder showing how its Tiny VGG model was trained.
- The model is a small teaching network. The page's output list has 10 classes: lifeboat, ladybug, pizza, bell pepper, school bus, koala, espresso, red panda, orange and sport car. It is not a general-purpose image recogniser.
- In our test we did not sign in and were not asked for any payment.
- The page's own feature list says you can upload your own image. We did not test uploading, and the README does not say how uploaded images are handled, so we make no privacy claim. Treat any photo you upload as something you chose to put into a web page.
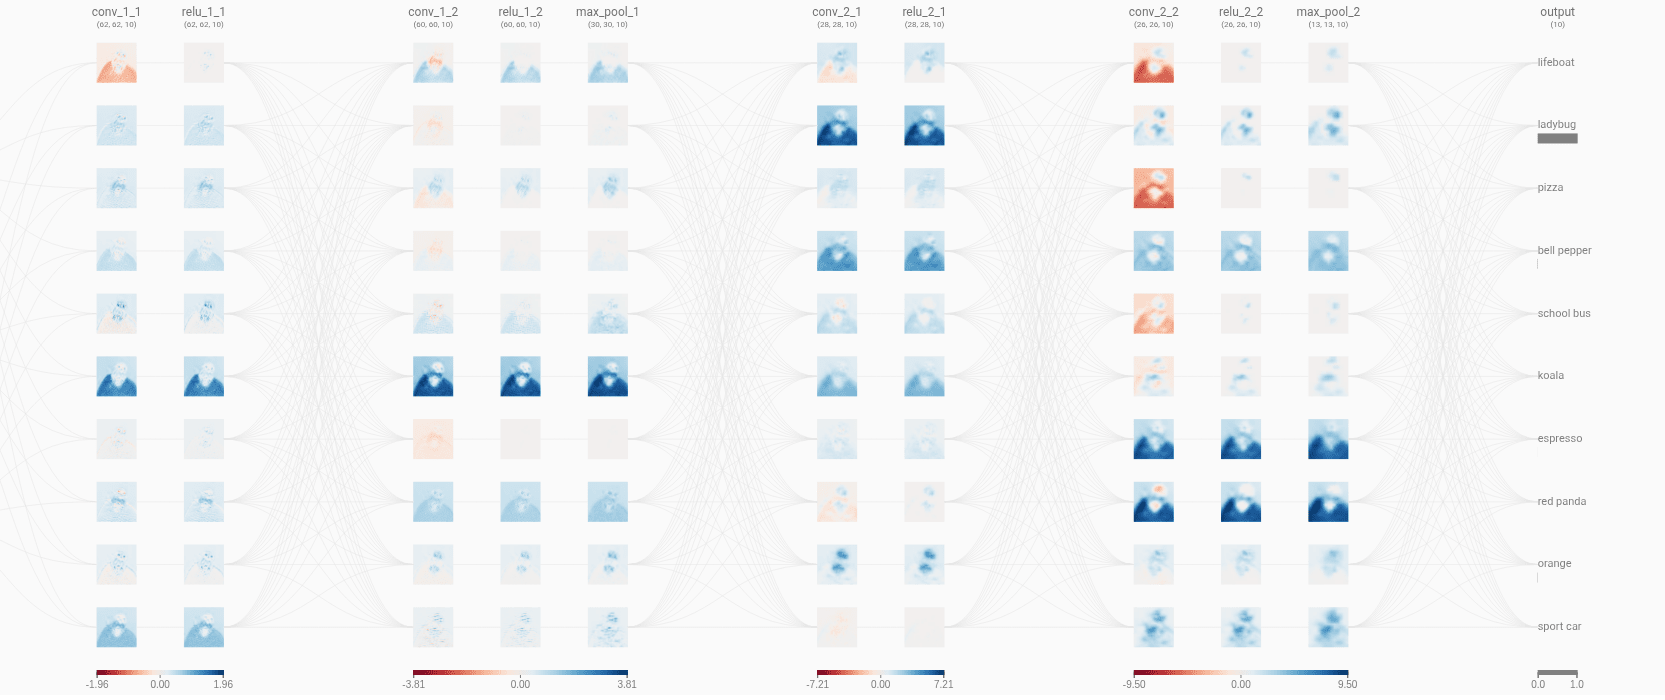
- The page shows small sample photos. We do not republish them, so our screenshot below is cropped to the network layers and output list.
Why use it instead of a chatbot
A chatbot can describe what a convolution, ReLU or pooling step is. CNN Explainer shows those steps drawn for a real picture going through a real small network: ten activation maps per layer, links between layers, and the final scores for each class. It is a way to see the stages for yourself. It teaches the idea with a toy model, so it does not tell you how large modern image models behave.
Our test
On 27 October 2026 we opened poloclub.github.io/cnn-explainer in a desktop browser. We did not sign in and used only the built-in sample pictures.
- Starting view: the page opened with the espresso sample drawn across the network, from the 64x64 colour input through the convolution, ReLU and pooling layers to the 10-class output. The espresso bar was the longest.
- Switching sample: we clicked the ladybug sample. The page took roughly 10 to 15 seconds to redraw. The activation maps changed and the ladybug bar became the longest.
- Show detail: we switched this button on and the layer labels in the diagram changed. We did not examine the detail view further.
- Not tested: uploading our own image, the interactive formula views, the video tutorial, running it locally, mobile use, or any picture outside the built-in samples. Two samples show the page working; they do not show how accurate the model is.
How to try it
- Open poloclub.github.io/cnn-explainer. The diagram at the top is already running on a sample picture.
- Pick another sample from the strip of thumbnails and wait a few seconds for the diagram to redraw.
- Read it left to right: input, then convolution, ReLU and pooling stages, then the output scores.
- Scroll down for the written explanation of each layer. The page's feature list also mentions uploading your own image, which we did not test.
Availability: the page is public and we found no country statement in the README. We did not check this from India, and our test does not show how it behaves from your location.
Sources checked 27 October 2026: